
The second of our series introduces you to the Net Promoter Score (NPS) a device first published in the Harvard Business Review in 2003. NPS is an incredibly important measurement for any business and should be a key indicator for everyone.
It’s overriding appeal is the ease of creation and its widespread usage, enabling easy benchmarking across many sectors and a handy measure of customer satisfaction at an organisation wide level.
However, a word of warning based on my experience, it is often misused and when considered in isolation, can be of limited use.
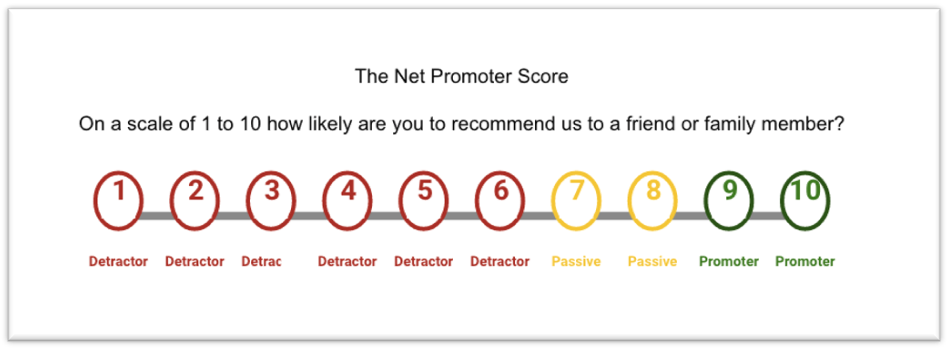
At its simplest, you simply ask your customers how likely are you to recommend us to your friends and family? It then sets a high bar, insisting that only the scores of 9 or 10 are your promoters and that anything 6 or lower is a detractor. You simply subtract the number of detractors from the number of promotors and get your Net Promotor Score – very different from an “average” score which can be a source of confusion.
It therefore means that scores can range from the perfect 100 (out of 100) or the “very suboptimal” – 100 (Even if everyone sampled gave you 5 out of ten.)
The debate about its effectiveness as a measure lives on. Whilst the argument about the correlation of business performance (growth, profitability etc) is taken as read, however, as a measure on its own – it fails to answer the key question… Why did you give me that score?
My recommendation is to use NPS as a great summary measure of your customer satisfaction and to ensure everyone within your company is tuned it to it, but to combine it with other more insightful research to understand the “Why?”.
It doesn’t need to be a huge additional burden – but a follow up question of why did you give us that score will help you understand why you get the good or the bad scores and what you need to keep doing, or stop doing as a result. I would also always recommend that you use these responses to augment your current segmentation1 and to build a picture based on values and attitudes as well as the usual RFM2
It need not be expensive nor difficult to get this additional insight. Depending on the size of your organisation and the frequency of purchases, a simple self-made survey (using the likes of Survey Monkey) may suffice. If you have a lot more customer data and are well invested in CRM, then I’d recommend a great tool used by RedRoute International called AIME, which brings in a wealth of rich data and has been proven to turbocharge marketing campaigns
Of course, once you have this rich segmentation, please, please, please, make sure that your marketing and product messages are tailored to their needs and attitudes. Get it right and your marketing ROI3 will go through the roof, your NPS will increase and your business will start flying! Even more importantly; you will be left basking in the glory of transformational marketing!
If this has stimulated some ideas, a desire to discuss in greater detail, or an air of confusion or uncertainty – please drop me a line. We can discuss how sophisticated your current methodologies are and importantly how sophisticated they need to be.
I look forward to chatting soon.
Joe – Joe Lynch Consulting & RedRoute International. For more on NPS give me a call on 07921 038051
Jargon Buster
- Segmentation. Grouping your customers and potential customers into groups that look and act like one another, to allow more personalised relevant communication
- RFM or Recency, Frequency and Monetary Value. Probably the most powerful and most used way of segmenting customers according to their spending habits with you based on, well, their recency, frequency and value of spend
- ROI. The Return on Investment of your marketing spend. The Holy Grail (well one of them) for all good marketing professionals. More on this next time!